4-minute read
We're all familiar with the concept of averages, and we have an intuitive capability to identify things that are about average or not, mostly learned through experience: we can spot an above-average size car or an unusually hot day without having to refer to tables of data.
But what about financial risk? Read on to find out...
The benefit of data
Unlike many operational risks, where estimations of likelihood and impacts are used to attempt to quantify risk, financial risks can draw upon large amounts of data.
Of course, we all know the ubiquitous disclaimer that past performance may not be indicative of future results, but by observing historical price movements – with the relevant macroeconomic context – we can obtain useful information and a feel for the behaviour of a market.
The FX market is the largest financial market in the world, with something like $7 trillion traded every day. The amount and quality of historical price data is substantial and can be put to good use for assessing the currency risk for any business.
Central tendency
If we're aiming to draw conclusions from a sample of past data, and build assumptions for future price movements, then we need to know the following:
- The typical value of the data sample
- How much the other values in the sample differ from the typical value
There are three measures of the typical value, also known as the Central Tendency:
- Mean: the average value (sum the values then divide by the number of values)
- Median: the middle value (half the data above and below when sorted in order)
- Mode: the most common value (the most frequently occurring)
✅ The mean is the most commonly used measure of central tendency and it's used extensively in financial risk modelling. However, care must be taken as outliers at the extremes of the data will influence (skew) the result.
✅ The median, as the middle value in a sorted list, is useful to compare to the mean for a quick measure of dispersion: if the median and mean are very similar values, then we can infer a fairly symmetrical distribution. We also use the median as the central tendency figure for range, inter-quartile range, and quartile deviation.
✅ The mode is mostly used for qualitative data and can obviously only be used where there is a most commonly occurring value. It's not used a great deal for financial risk.
Sticking to FX risk; because prices change on a continuous basis we need to establish the interval of the data sample. It's most common to use daily price intervals – typically the closing rate – for use in medium- to long-term analysis.
Analysing intraday price changes can be interesting, but the amount of data becomes cumbersome and the established norm is to use the daily figures.
Harry Mills, Founder & CEO Oku Markets
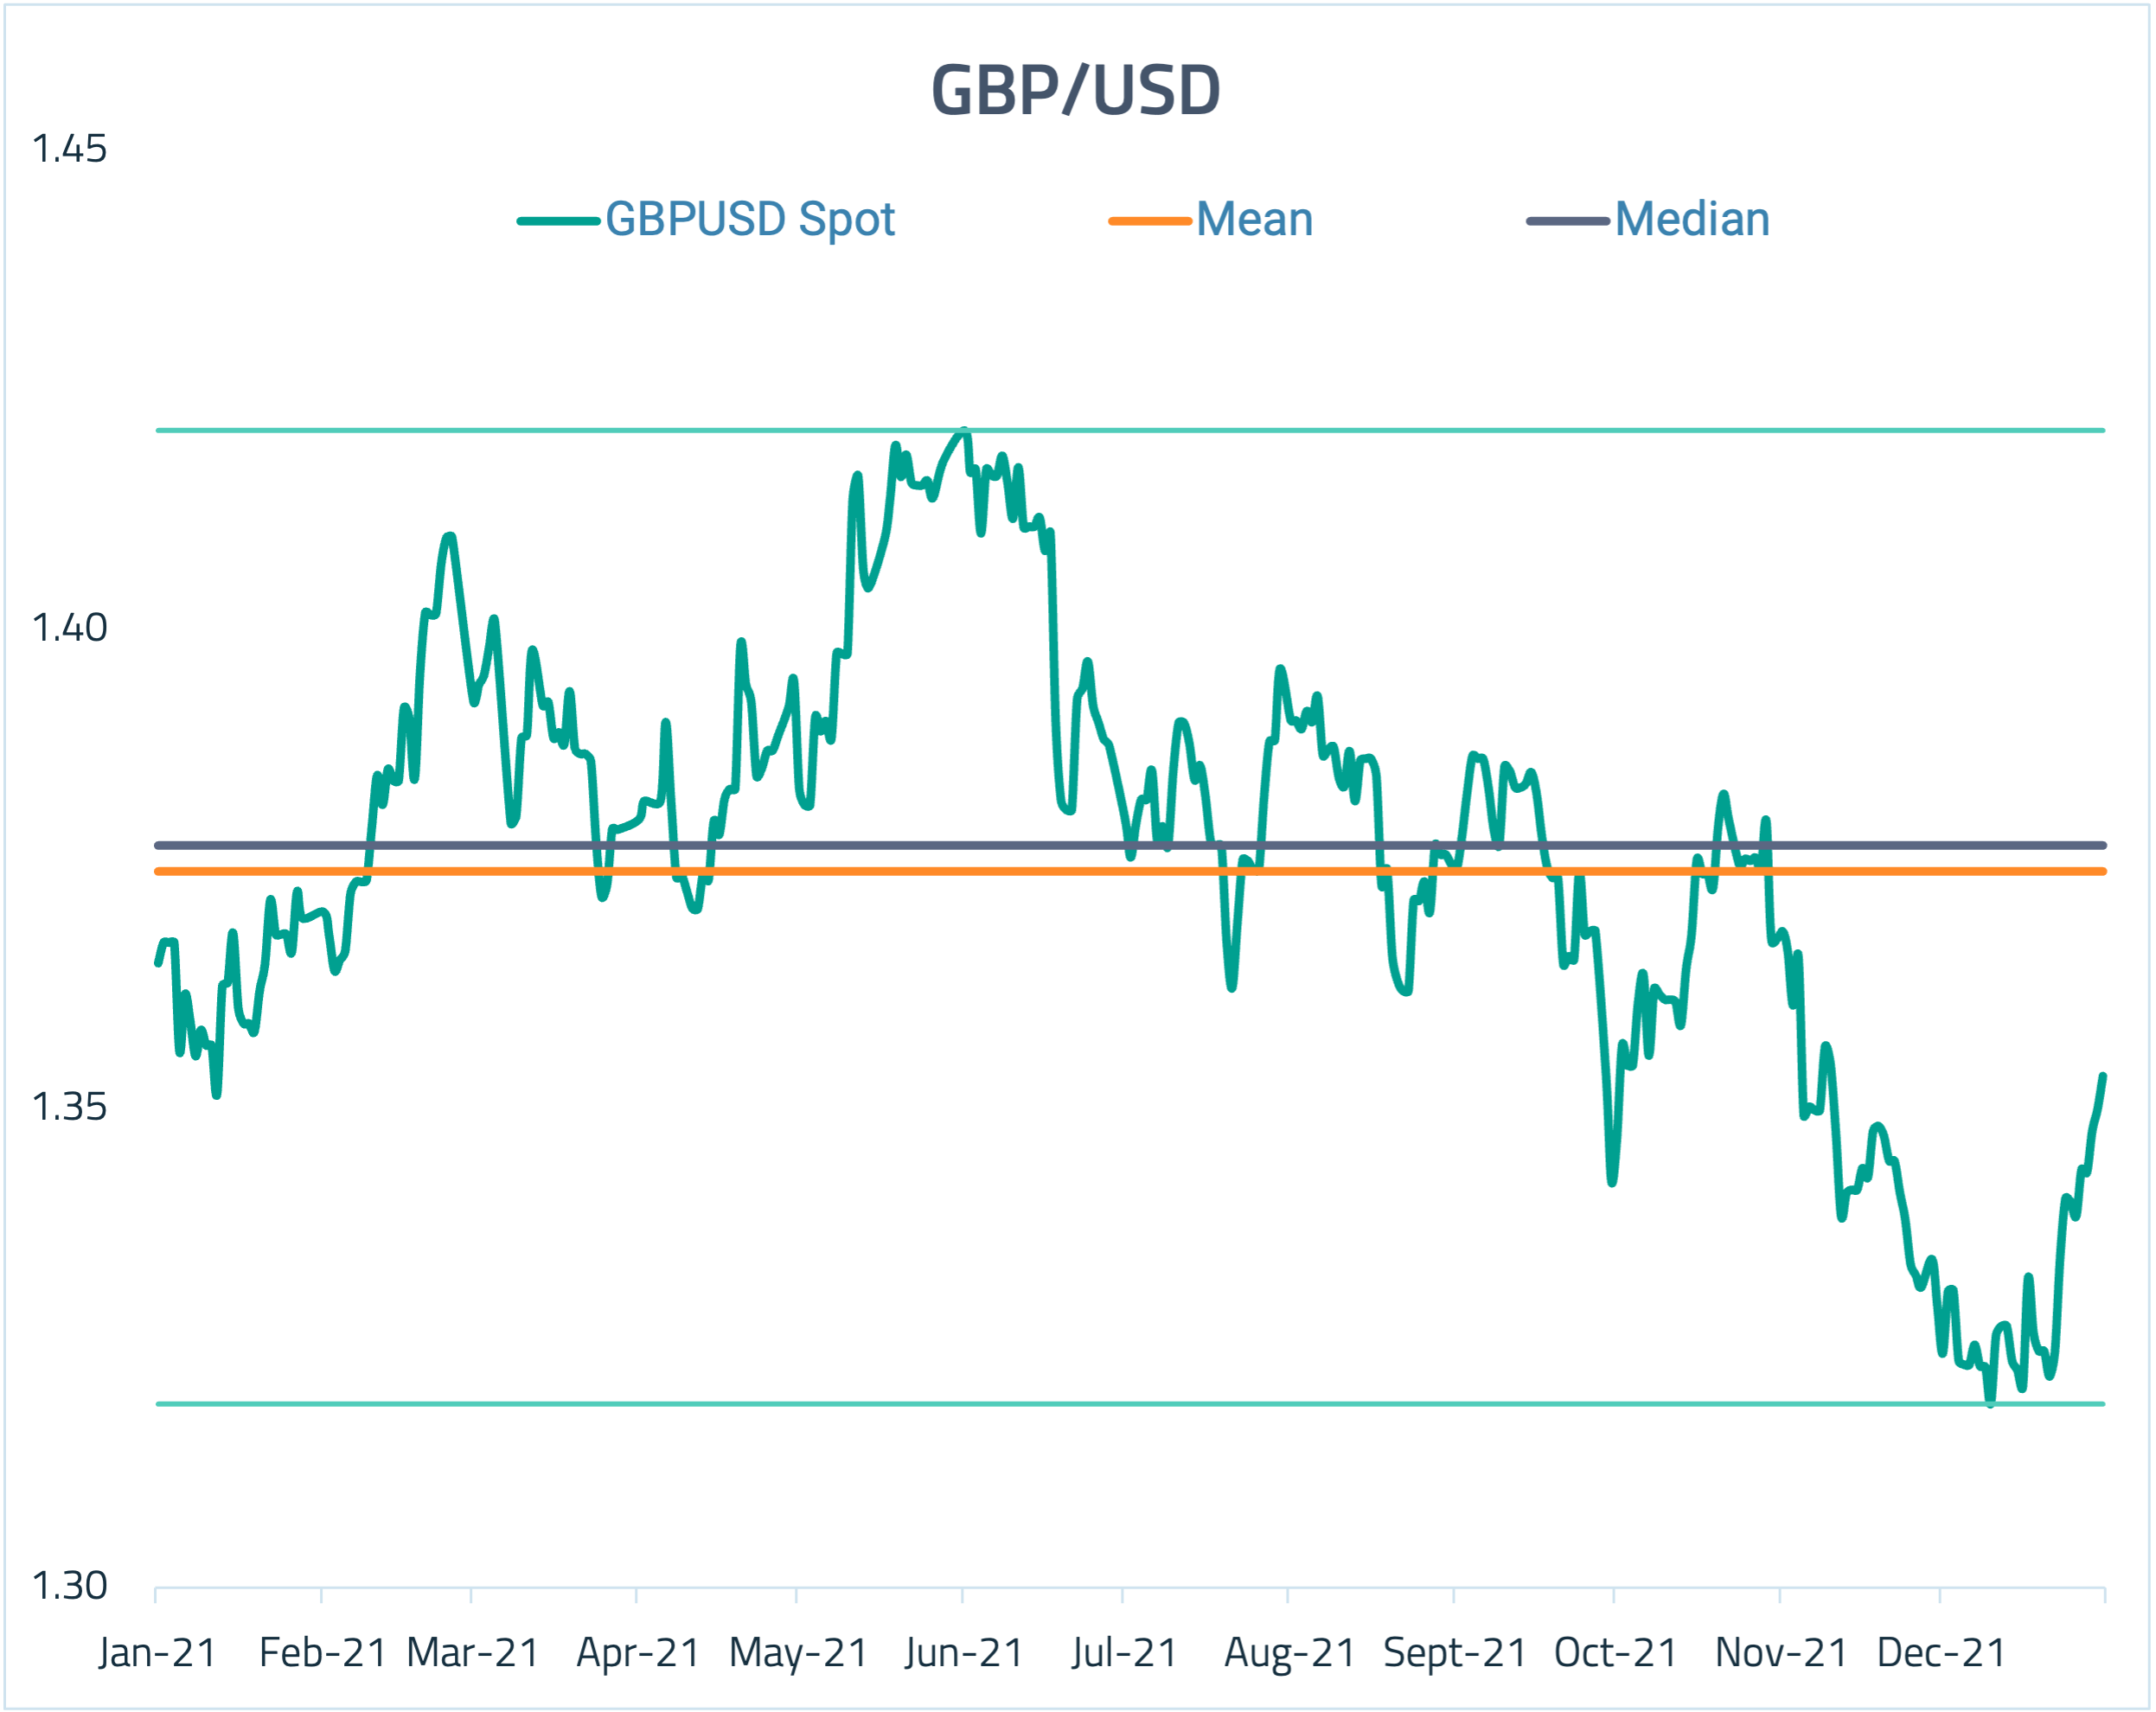
Let's look at a quick example of GBPUSD for 2021 (daily):
- The Mean price was 1.3747
- The Median price was 1.3775
- The period high and low prices have been plotted for a visual aid (1.42/1.319)
- As the mean is below the median, we know there is a negative skew to the data
Keep rolling
It's common to use moving (or "rolling") averages of financial prices to observe long-term trends by smoothing out extremes in the data sample. Often shorter-dated moving averages are compared to longer-dated ones, for example, the 30-day vs the 200-day. This can be used to spot bullish or bearish trends, but that's more a technique used by traders than corporate risk managers.
Dispersion
Now we know the typical value – the average price across the period – the next step is to answer the question, how much do the other values in the sample differ from the typical value?
Do prices tend to stay close to the average, or is there a large variation? Does the price move around a lot? We instinctively have a feel for what the term volatility means, but it's a proper statistical measure of the dispersion of the data around the average.
Just looking at the GBPUSD chart above, we can see that the daily price did differ from the mean during 2021. It would be useful to be able to quantify this and draw comparisons: was this a "normal" year? How does it compare to other currency pairs?
The calculation of dispersion around the central tendency will be covered in a future article, but for now, we hope this has been a useful reminder of the different types of "average" and how they can fit into financial risk management.
What's next?
If you find this interesting and you'd like to know more, then can contact Oku Markets at 0203 838 0250 or info@okumarkets.com. We'd be happy to provide you with some key risk stats for the currency pairs that you trade and discuss the ways you can reduce the impact of currency fluctuations and market volatility on your business.